CAS Graphing Scientific Calculator
fx-CP400
User-Friendly CAS (Computer Algebra System) Features Provide Visual Support for Mathematical Exploration
fx-CP400 has intuitive operability and exploring features, ideal for mathematics learning.

Support Resources
Features
1. Easy and Intuitive Operability

Intuitive feature makes it easy to use the features of fx-CP400.
This feature makes the fx-CP400 ideal for mathematics learning.

The user-friendly Icon menu, Function keys and Interactive format enable intuitive operation.


Intuitive pinch-in / pinch-out control allows you to easily adjust a graph to the exact display size that you desire as zoom in or zoom out.

By slider function to the Graph / Geometry the control to freely change values allows you to learn their relationship with other values by freely changing shapes

Mathematical formulas can be graphically displayed without any complicated key operations - simply drag and drop the formula into the graph area!
2. Essential Functions for Learning All in One
CAS Graphing calculators have a variety of functions covering from primary to higher education. Students can cultivate mathematical thinking through Graph functions operated by themselves.


3D Graph function
CAS(Computer Algebra System) is a software program facilitating symbolic mathematics.

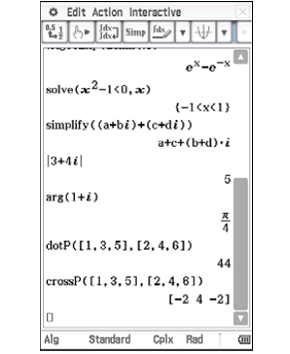
Expand, Factor, Simplify calculations

Solve, Complex, Vector calculations

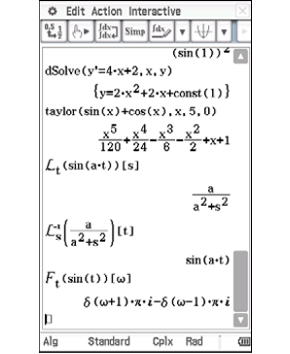
Limit, Differentiation, Integration calculations

Differential equation, Taylor polynomial, Laplace transform calculations

Upright? Horizontal? Both!
Interactive Differential Calculus
Visual, intuitive operations make it possible to learn the concept of differentials which is often hard to understand for students.
Function and tangents

Plot coordinates of the slope of a tangent and predict the function

Function and its first derivative formula
You can learn differential coefficients and derivative formulas by exploring this function.
Differential Equation Graph
The solution set of differential equations can be represented as graphs in vector fields, and solution curves can be drawn by providing initial conditions of the equations.
Slope field and solution curves for the initial conditions
Graph

Upright view - Horizontal view

Formula and Graph at the same time

Inequality Graph

Parametric Graph
3D Graph
Use of the 3-dimensional graph drawing function allows for the depiction of more complicated graphs. Supports the study of topics such as “spheres” and “planes,” which can be difficult to understand from just a textbook or class notes.


Example
Explore in a variety of ways.

Equation and Graph

Graph

Graph and Table

Graph and Summary Table
Statistics

Statistics using Spreadsheet function

Statistics using Color Link function

Statistics using eActivity function
Geometry

Geometric graphing


Geometric graphing using drag and drop

Triangle and circle
3. Extensive and Advanced Features

Science and Technology Education
Data-logger can be used with graphing calculators and is effective for both mathematics education and science and technology education.

This feature is useful in science experiments
E-CON is an application used to operate a data logger, a device used to collect data. E-CON makes it easy to collect data for use in classroom science and technology lessons.

Periodic Table

Fundamental Physical Constants

Financial

This feature is useful in science experiments
This mode allows you to quickly prepare your calculator for exams. This mode restricts access to memory, programs, functions and applications, so that these features would not be available during exams.
Teacher's Voice

School
Math and Science Division Chair at Lyons Township High School
LaGrange Illinois (USA)
Name
Ismael Zamora
Comment
The invention of the graphing calculator forever changed the face of mathematics education. I feel that the Casio fx-CP400 has once again changed how we teach mathematics. The ability to interact with equations and graphs on a single screen is revolutionary. I can now focus on the connections between concepts. The fx-CP400 allows me to explore connections between geometry, statistics and data analysis through the use of data collections. It allows my students to make conjectures and model the mathematics that is right in front of them. The ability to graph in 3D allows my students to see the world in a whole new way and allows them to ask and answer questions I have never been able to ask them before.


